National headlines need local context
National home price headlines can point in opposite directions because they measure different markets and different parts of the sales process. Asking prices are easing as autumn brings fewer buyers, while closed sale prices still vary sharply by city. Those figures can both be accurate: one tracks what sellers hope to get, and the other records what buyers and sellers agreed to pay. For market participants, the local figures matter most.
That distinction is easy to lose when a national median stands in for a complicated collection of local markets. A change in the asking price may signal that sellers are adjusting expectations, but it doesn't show whether completed transactions are falling at the same pace. Nor does a national figure tell you how a particular type of home is performing in a particular neighborhood. The headline is a starting point, not a verdict.
Seasonal easing in asking prices
More homes are listed for sale than at any point since November 2019, and homes are taking longer to sell as mortgage rates have risen since spring. Sellers facing that competition may set lower asking prices to attract buyers. When more listings compete for attention, a seller's initial price can become a more active part of the sales strategy, especially if a home sits on the market longer than expected.
HousingWire Data puts the national median asking price at $435,000, down from $449,000 in early August—a decline of about 3% in roughly two months. That's a meaningful change in seller expectations, though it doesn't establish that completed sales have fallen by the same amount. Asking prices can be revised before a sale, and homes that don't sell aren't represented in closed-sale figures.
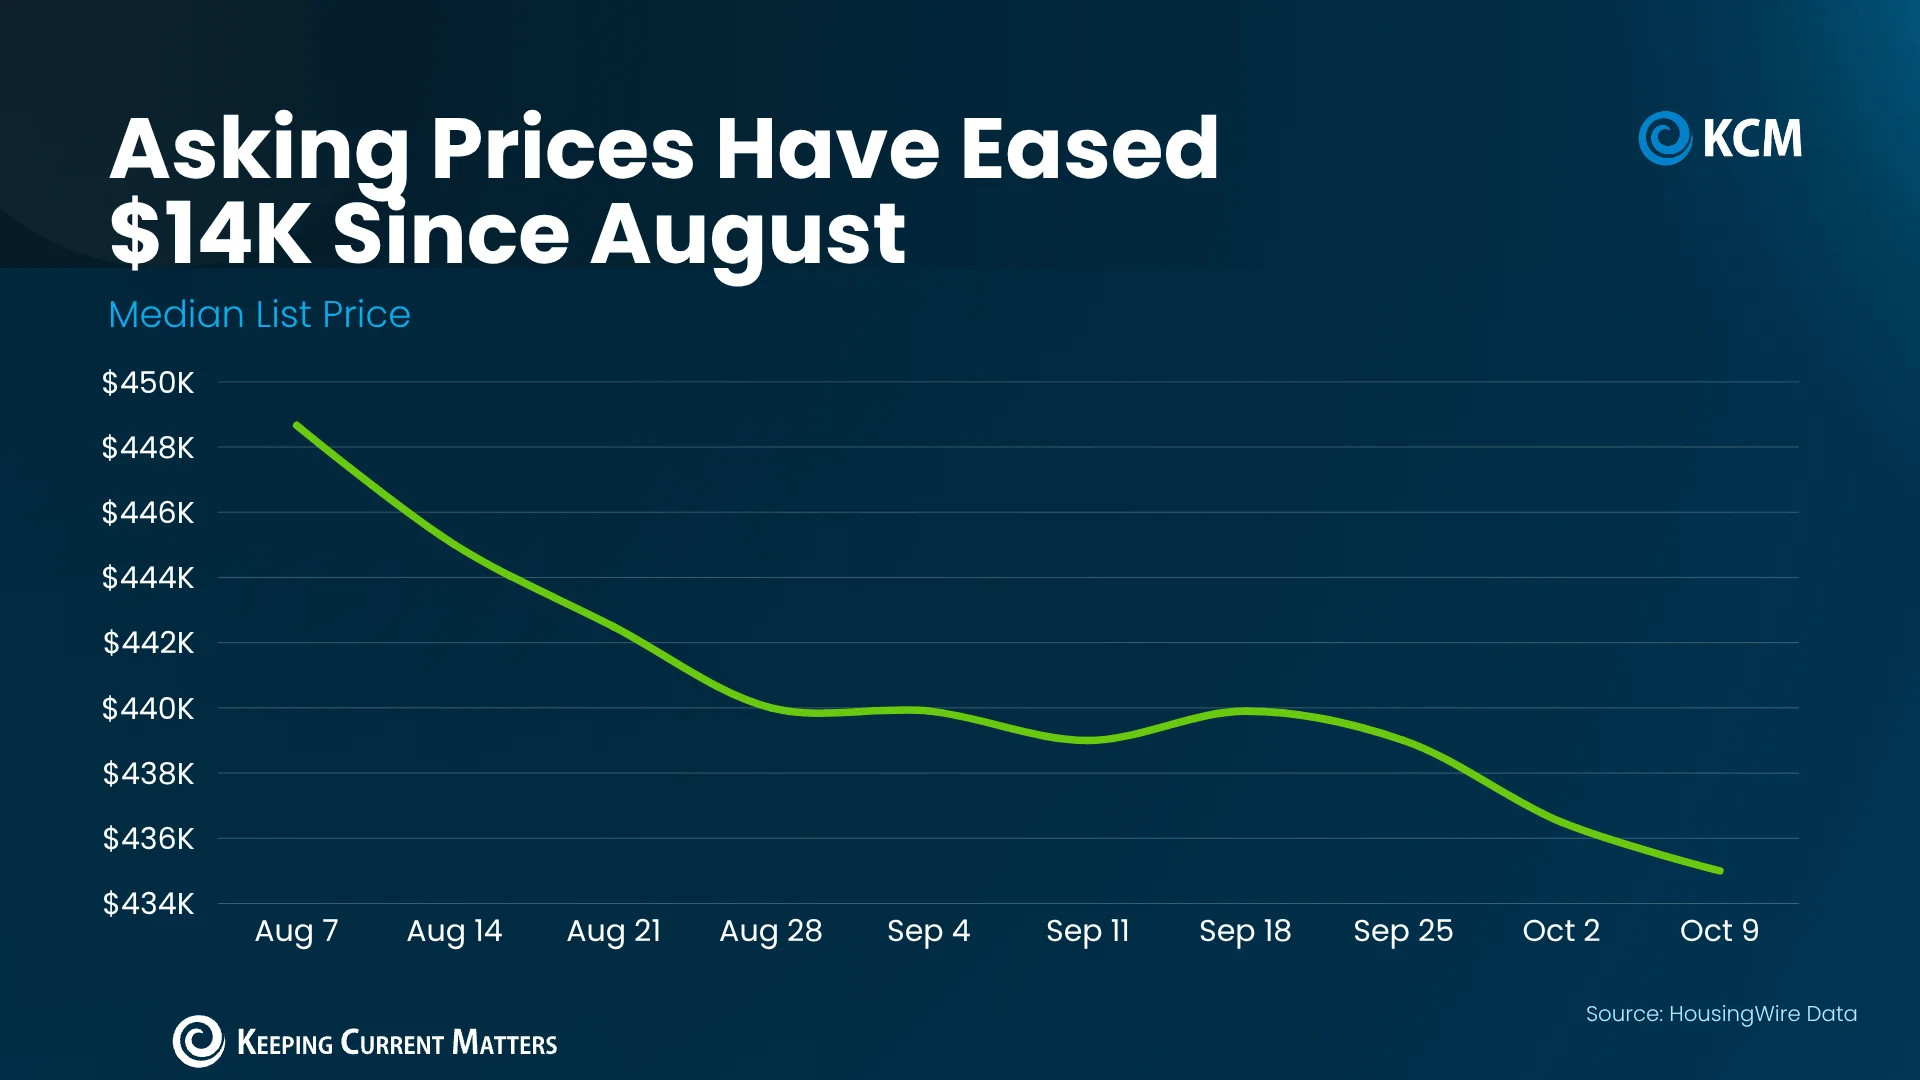
That pullback partly reflects the usual fall pattern: the summer buying season has passed, and sellers often price more competitively as buyer activity cools. Current mortgage rates also shape what buyers can afford, influencing list prices. When borrowing costs rise, a household's budget may support a lower offer or a less expensive property, which can affect how sellers position a listing. Still, an asking price is an opening position. It doesn't tell us what properties are ultimately selling for, either nationally or in a specific neighborhood.
And this is the part most people overlook: a lower median can reflect changes in the mix of homes being listed as well as changes in individual sellers' prices. Without more detail on that mix, the national number alone can't explain why it moved. Useful signal, but limited evidence.
City-level results tell a different story
The gap between local markets is striking. The latest S&P Cotality Case-Shiller Index figures show Chicago sale prices up almost 7% over the past year, while Seattle prices edged down about 1.6%. That's a spread of nearly nine percentage points between two major cities. A national trend can smooth over this kind of divergence, leaving buyers and sellers with a picture that fits neither city particularly well.
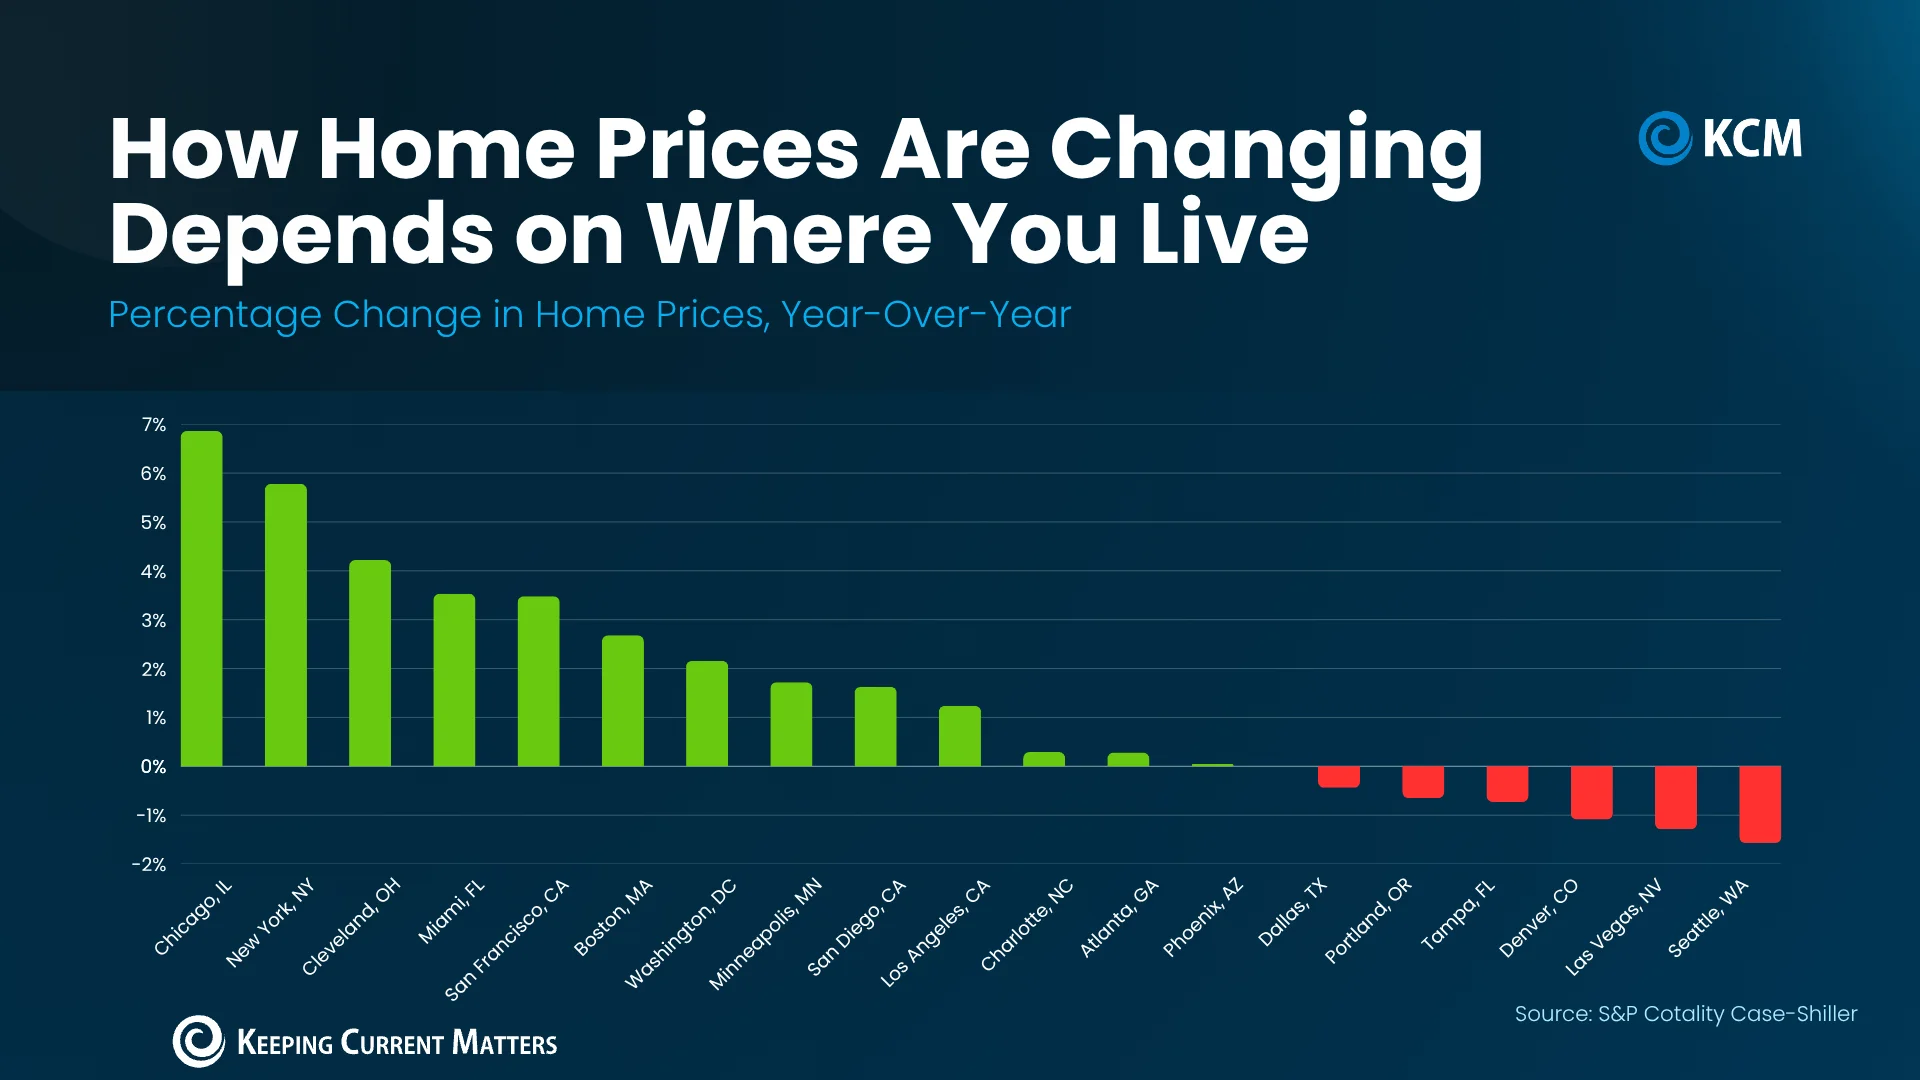
New York also recorded price growth of almost 6%. Those gains suggest sellers there may not face the same pressure to reduce prices as sellers in softer markets. Buyers in Denver or Las Vegas, by comparison, may have more room to negotiate. That doesn't mean every home in a growing city is gaining value or every home in a softer market is losing it. The result depends on location, price bracket, property type and the market's post-pandemic trajectory.
Realtor.com says, “While national headlines might suggest a buyer’s market is taking hold, the reality on the ground depends heavily on where and what you’re trying to buy. Local trends can diverge sharply from national averages, especially when you factor in price range, property type, and post-pandemic market dynamics.”
That distinction matters when translating a national statistic into a pricing or offer strategy. A national median can describe a broad trend, but it can't establish the likely sale price of a home in a particular market. Even citywide data may mask differences between neighborhoods and property types, so the right comparison needs to be close to the home being considered.
Small declines aren't evidence of a broad crash
Even in major metros where prices have fallen, the reported declines are 2% or less—far from the scale of the 2008 housing crash. More cities in the cited comparison posted gains than declines, according to the figures discussed here. That pattern points to uneven adjustment, rather than a uniform drop across the markets covered.
The longer-term record also provides context. The Federal Housing Finance Agency reports that national home prices have risen year over year in every quarter since 2012. Its historical comparison estimates that a home worth $100,000 in 1991 would be worth about $436,000 today, including the effects of the 2008 downturn. That long view helps put a short period of easing in perspective, although it doesn't predict what prices will do next or resolve the differences between cities.
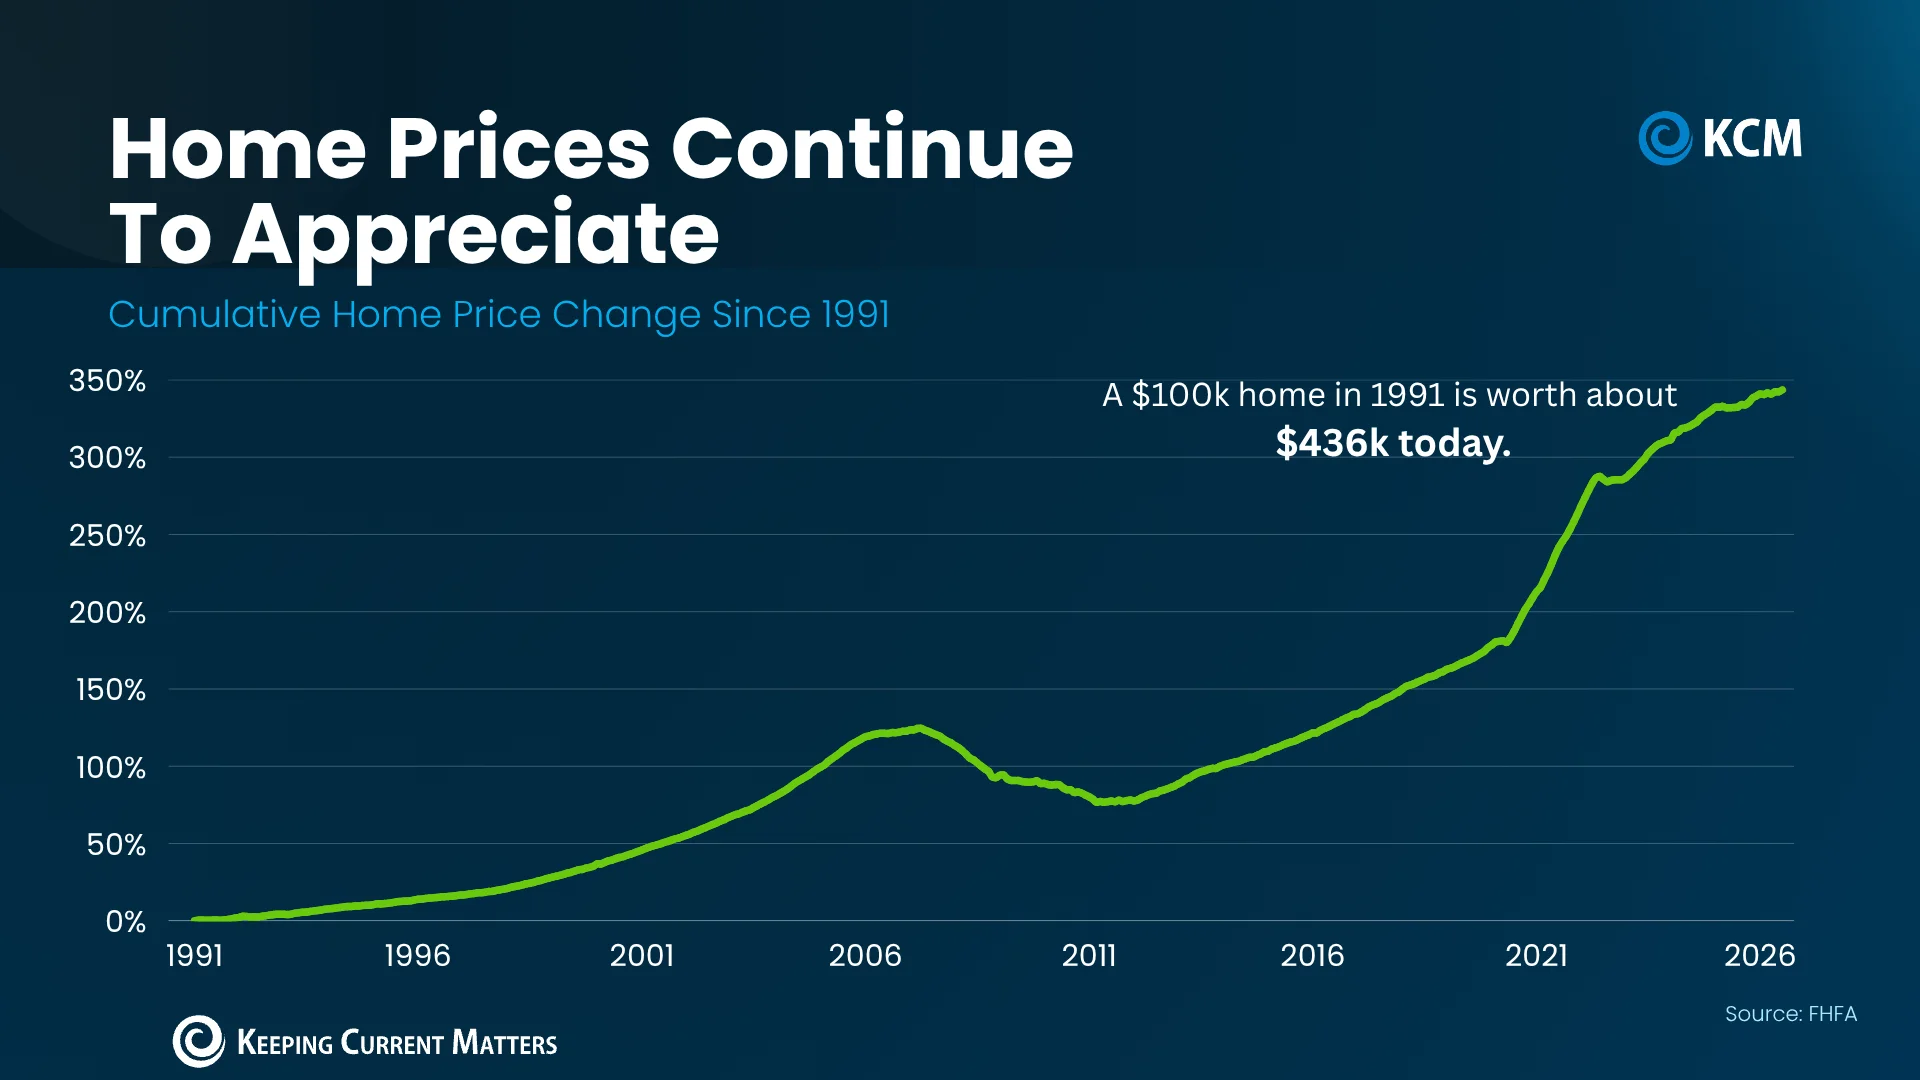
Some of today's modest declines are in markets that ran especially hot during the pandemic. A market coming off a sharp surge may behave differently from one with a steadier history, and recent price changes can reflect that uneven path. The current data points to a market normalizing after that surge, with national prices having risen over the long run even as individual cities move at different speeds.
This is more significant than it looks: a modest city-level decline and a long record of national price growth can coexist. Neither erases the other. The key is to keep the time frame and geography attached to each figure, rather than treating every reported change as evidence of the same national story.
What divergence means for pricing decisions
Here's the thing: national asking-price trends describe seller expectations, while local closed sales show what buyers have paid. Neither figure alone settles the question for a specific property. If you're working in this space, the practical task is to compare recent local sales with homes similar in location and type, then read those comparisons alongside current listings and the time homes are taking to sell.
That process can show whether sellers nearby appear to be holding their prices, adjusting them, or meeting more buyer resistance. It can also help keep broad market claims in proportion: a citywide gain doesn't guarantee a strong result for every listing, just as a national decline doesn't prove that every local seller must cut a price. What this means for you depends on the evidence in the immediate market.
As markets diverge, local sale data will remain the clearest guide to whether prices nearby are rising, holding or easing. The national figures can frame the discussion, but the neighborhood comparison is where a pricing decision becomes grounded.